Choosing a Causal Inference Book
I’ve been thinking about causal inference books a lot lately. I’m currently reading Facure’s Causal Inference in Python in a reading group, and on the side I’m reading the second edition of Causal Inference: The Mixtape (aka, The Remix).
And I’m already trying to decide what to read next.
Brady Neal’s 2020 Flowchart
In 2019, Brady Neal created a well-known flowchart for selecting a causal inference book (updated in 2020). That chart is great for what it includes, but it’s now 6 years old and its most recent books are Causal Inference: The Mixtape (2018) and Causal Inference: What If (2020). It can’t help navigate more recent books. I want to choose between books like Ding’s A First Course in Causal Inference (2023) or Ness’s Causal AI (2025). Or the Aug 2026 draft of Causal Inference: What If.
Reinvestigating the Question
I already have a pretty good idea of what I want to read based on tables of contents and reading sample passages, but I wanted a higher-level view and also wanted to maybe save others time.
So I decided to chart the topics covered by eleven recent books.
The results are below in three forms:
- An interactive chart where you can toggle between high-level and granular coverage
- A categorization of books, based on the topic coverage, and their difficulty and prerequisites
- A static topic-coverage chart at the bottom
Detailed Topic Coverage in Eleven Recent Causal Inference Books
Here is the full chart, with top-level summaries and detailed sub-topic coverage. I’ve collected nine top-level topics into three groups: “foundations”/“shared core” and what I’m calling “measurement tradition” (measuring treatment effects) and “modeling tradition” (building explicit causal models and querying them). I admit this terminology is not ideal, because “model” is overloaded. Hopefully the sub-topics make it clear.
Each book (author) is a column, with rows encoding coverage of general topics when collapsed and specific sub-topics when expanded. Columns are ordered by optimal seriation, placing books with similar coverage next to each other.
Click on a top-level topic to expand or collapse a section, or click on “expand all” and “collapse all” for all sections at once. Hover over an author for book info. Click on an author to go to the book page.
1. Foundations (10)
2. Selection on observables (15)
3. Time-varying & g-methods (6)
4. Quasi-experimental designs (21)
5. Industry experimentation (4)
6. Heterogeneity & causal ML (7)
7. Structural modeling (11)
8. Counterfactual computation (4)
9. Decisions, RL & modern AI (6)
I picked technical textbooks published or updated since 2023. The books themselves determined the space of topics; a topic must appear in at least one book to be included. But topics were also chosen in a somewhat ad hoc fashion based on how informative they were for comparison. To determine coverage, each book was first searched for headings, then terms, and then the text was scanned near term hits to determine true positives. Each book topic was graded as “covered”, “mentioned”, or “not covered”.
A couple quick takeaways: There’s a definite “S” pattern across the summary charts, and the fully expanded view has clear groupings between nearby columns. Sub-topic patterns might be easier to scan in the static chart at the bottom.
How to Choose
If topic coverage is all you need, then you should be good with the chart above. However, these books differ in many other important ways that might influence your choice. For example, they come from different academic traditions (e.g., epidemiology, econometrics), are aimed at slightly different audiences (e.g., students, tech workers), and have varying difficulty and prerequisites.
The chart below breaks the books into rough groupings based on their coverage. It also gives a brief description of each book, its difficulty, and prerequisites. Hopefully this information can help narrow down your choices.
Full Static Chart
Finally, here is the static version of the chart, with every sub-topic visible at once. Books are in the same similarity-based order as the interactive charts above. I find this version useful when looking for patterns across all sub-topics.
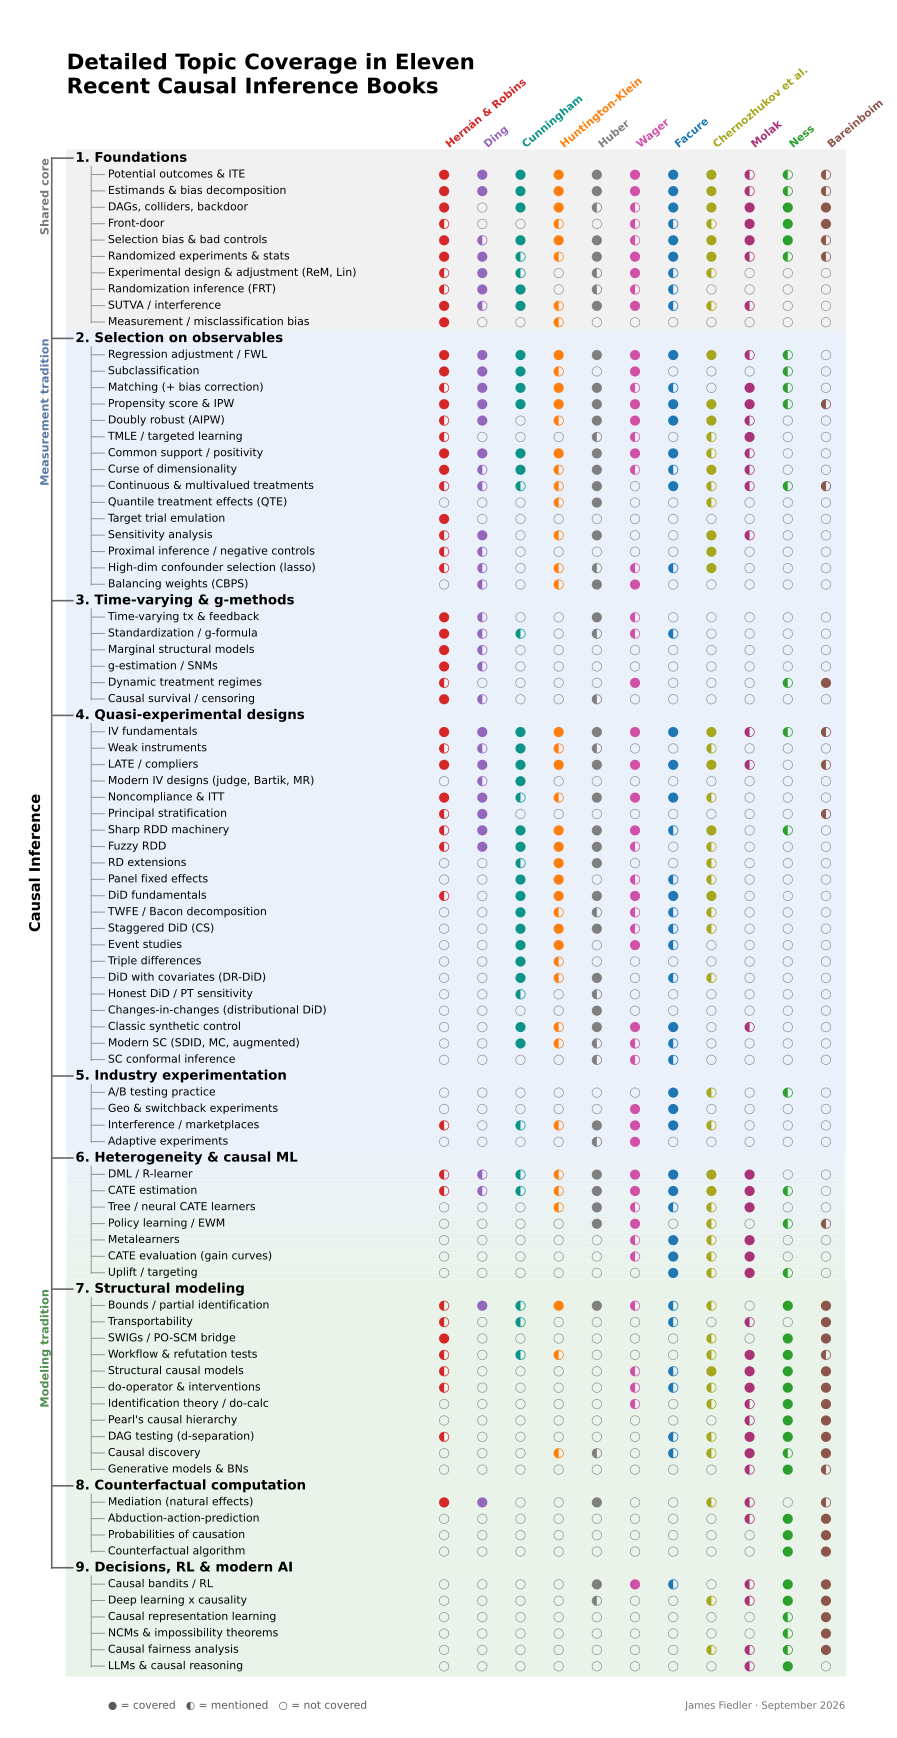
N.B. These charts are first drafts: I haven’t read most of these books cover to cover, and the grades come from targeted searches. I’ll revisit this post later to see how well the topics and coverage grades hold up after I’ve done more reading.
As for my own question—what to read next—the chart did its job: I’m leaning toward books that complement Causal Inference in Python by covering a bit more of the modeling tradition.